


Production and dispatch reporting. Real-time visibility on production status, dispatch timing, delivery confirmation and returned mail across every send.
Data-Driven Innovation
Visualise
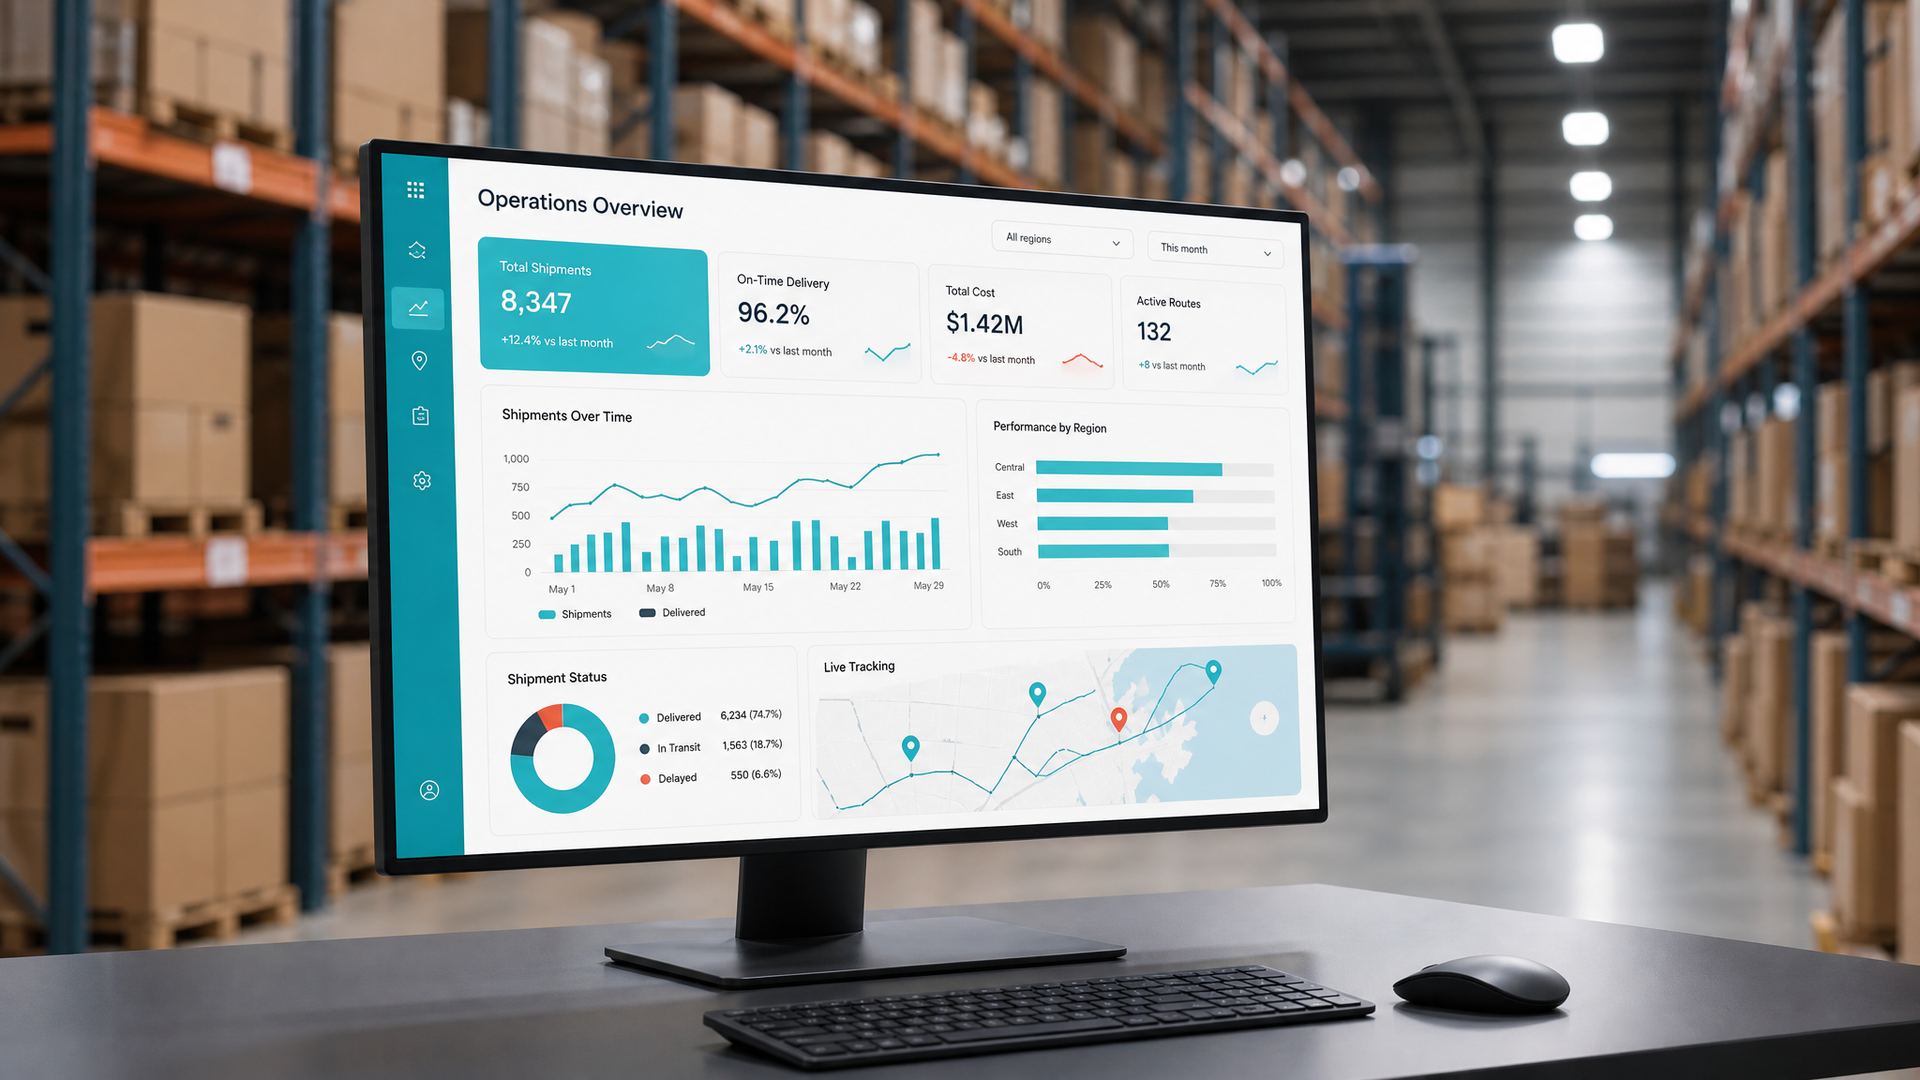
Reporting and analytics on the print, mail and communications programs we run. Deliverability tracking, response attribution, campaign performance and program-level intelligence, surfaced through dashboards you can actually use.
Where Visualise fits
The value of a data-driven communications program is only proven at the reporting layer. If a client cannot see which segments responded, which touchpoints landed, and where the wasted spend sat, the next campaign gets designed on the same assumptions that produced the last one.
Reacon's Visualise service is the reporting and analytics layer that sits on top of the programs we run. It turns operational data from print production, mailhouse execution, deliverability and response into dashboards, reports and program-level intelligence that inform the next brief.
What we do
Deliverability tracking. Australia Post lodgement, In-Home Date estimates, undelivered mail rates and address correction outcomes reported at campaign and segment level.
Response and attribution reporting. Where a campaign carries redemption codes, response cards, unique URLs, or match-back windows, we report response rates and revenue attribution at segment and cell level.
A/B and multivariate test reporting. Where a campaign runs test cells (creative, offer, format, timing), performance is reported by cell so the next campaign can be built on evidence rather than opinion.
Program-level analytics. Across a rolling program (donor appeal cycles, franchise reorder cadences, patient communications), we report on longitudinal performance to inform how the program is designed and where investment shifts.
Custom dashboards and scheduled reporting. Standing dashboards for the client team plus scheduled reports for the board, marketing leadership or compliance sponsor, in the format they need.
Data export to client BI environments. Where the client runs Power BI, Tableau, Looker or an equivalent, we can push data feeds into those environments rather than duplicating the work in a Reacon dashboard.
What we do not do
Our reporting is delivered as part of the programs we run, not as an isolated product. Where a client wants deeper analytics infrastructure, we work with their existing partner.
- We do not sell a standalone BI platform
- We do not replace client-side analytics tooling
- We do not build custom analytics products under a licence
When Visualise matters
Visualise pays back in three situations:
Program justification. The marketing or compliance team needs to demonstrate program value to a board, budget owner or regulator, and needs performance data at the level the audience will accept.
Optimisation. The campaign is running well but the client wants to know which cells, offers or segments are working hardest, so future spend concentrates in the right place.
Cross-team visibility. The client team responsible for the campaign, the finance team responsible for the budget, and the operations team responsible for fulfilment all need the same source of truth, at different levels of detail.
Data handling
All reporting runs off data captured in the course of running the campaign. Nothing is shared beyond the client scope, no data is repurposed, and every dashboard operates under our ISO 27001 information security framework.
Certified where it counts
ISO 9001
Quality management
ISO 27001
Information security
PCI DSS
Payment card data handling
HACCP
Food safety for packaging
How to get started
Send a brief through the contact form or start-an-order page describing the program you want reporting on, the audiences the reporting needs to serve, and any specific KPIs already in use. An account lead will scope the work and issue a quote.